Premium Members can now use Google Analytics to get meaningful insight about the traffic to their deviantART Profile! Using our new Google Analytics integration, you can access comprehensive statistics about your audience, traffic, and art.
Get Deeper Insight Into Your deviantART Traffic
By enabling the feature on your profile, you can now use Google Analytics to get a better grasp on the deviantART experience that you’ve created for your audience!
- Understand what types of people are organically drawn to your work. Where do they live? How long are they on your page?
- See the impact of the marketing you do outside of deviantART. When you share your deviantART work and links in other networks and sites, you’ll be able to track the traffic back to your Journals, Gallery, Profile, and much more!
- Understand what your visitors are looking at when they’re on your Profile and even for how long! Sometimes visitor trends are unclear until you can see the bigger picture.
- Evaluate the difference in attention you get for some types of work versus others.
- See a direct correlation between your marketing activities to deviation submissions and spikes in traffic to your Journals, artwork, or Profile pages.
Learn More About Your Audience
Knowing who is engaging with your Profile can help you make decisions about where to hang out, what Groups to join, and other things you might want to share with your audience.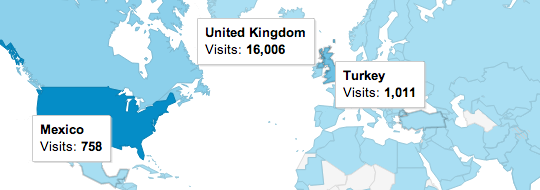
Watch Realtime Activity Flow To Your Profile
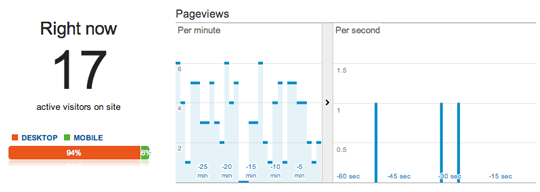
Google's realtime reports allow you to sit back and watch activity happening on your content right this second.
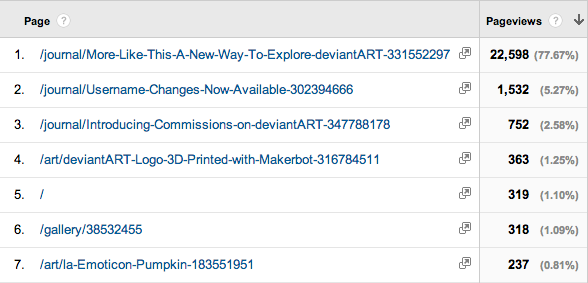
View Traffic Stats For Your Content
Google Analytics allows you to dive into traffic stats for deviations, Journals, Galleries, Collections, and other areas of your Profile Page. See which deviations are the most popular today and find out where that traffic is coming from.
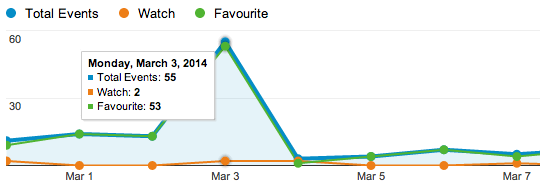
Track and Analyze Your Watches and Favourites
Our Google Analytics integration tracks when someone watches or adds your artwork to their favourites, allowing you to view charts and statistics of these events. How many favourites did Reddit traffic give you this week? How many new watchers did you gain last weekend after submitting your newest deviation? Did you gain more watchers this month or last month?
Favourites and Watches are available under Google Analytics' "Events" reports.
Favourites and Watches are available under Google Analytics' "Events" reports.
...And A Ton Of Other Reports
Here's just a sample of some of the stats you can see:
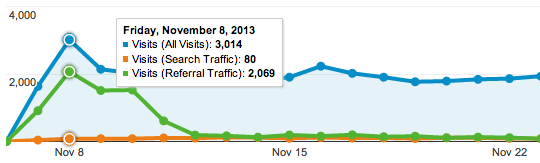
- Traffic charts, graphs, and statistics by date
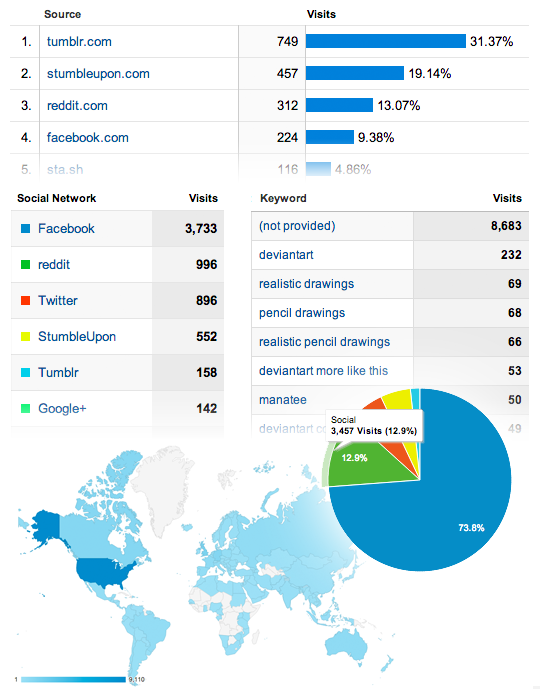
- Traffic demographics (geographic locations, languages...)
- Visitor stats (new visitors, returning visitors, time spent on pages, number of pages viewed, bounce rates...)
- Top sites and social networks sending you traffic and, for some social networks, the individual posts that are linking to your content
- Search engine keywords people are using to find your Profile Page and content
Measure How Your Activity Impacts Your Audience Growth
Google Analytics can help you make decisions on how you manage your deviations. It can also allow you to see the impact of your on site activities.
- If you find that your audience is more active on certain days or times, you’ll be able to determine a schedule for posting new art or Journals.
- Perhaps you’ll find that the more you comment, the more you see your pageviews and watch list jump.
- If commenting, and critiquing others’ artwork for example, helps increase the level of activity on your Profile, perhaps you’ll decide to do this more frequently.
Ready To See Your Stats?
Not a Premium Member? Go Premium!